How the ‘3 Pillars of Observability’ Miss the Big Picture

Honeycomb sponsored this post.

Observability is a relatively new concept being applied to production software systems. In an attempt to explain what it means and how to achieve it, some have tried to break it into three parts with the “three pillars of observability” — splitting it into metrics, tracing, and logs. But I think that misses a critical point of what it means to observe a system.
Observability measures how well you can understand your system’s internal state based on signals and externally-visible output. The term describes one cohesive capability. The goal of observability is to help you clearly see the state of your entire system.
When you unify these three “pillars” into one cohesive approach, a new ability to understand the full state of your system in several new ways also emerges. That new understanding doesn’t exist within the pillars on their own: it’s the collective sum of the individual parts when you take a unified approach. Simply defining observability by its individual components misses the bigger picture.
Considering Capabilities on Their Own
A good analogy for describing how this system comes together is one of using color-filtering lenses. Color-filtering lenses remove some wavelengths of information in exchange for emphasizing others. When you need to focus on particular shades of red, using a red lens can help and it’s the tool you should reach for. But in order to see the big picture, you need to be able to see all the vivid colors as they come together in real time.
For example, let’s say that you notice that a production service seems to be acting up. Let’s look at how different lenses see that problem.
Monitoring and Metrics
An alert has been triggered, notifying you that the number of incoming connections is higher than a specified threshold. Does that mean users are having a poor experience in production? That’s unclear. But this first lens, monitoring tools (i.e.metrics), can tell us some very important things we may need to know.
The metrics lens reflects the state of the system as a time series of numbers that are essentially used as gauges. At any given time, is each measure performing over or under thresholds we care about? That’s certainly important information. Metrics become even more important when we can slice down your time series and use a different one for each machine, or each endpoint.
A metrics monitoring tool (e.g. Prometheus) can be used to trigger an alert when the metric exceeds specified thresholds for a predefined length of time. Most metrics tools let you aggregate performance across a small number of labels. For your triggered alert, that might help you simply see which service is experiencing a problem, or on which machines it’s happening.
 To narrow down more precisely, though, you need to see your metrics with high cardinality — to track hundreds or thousands of different values. This can let you create views that compare enough time series that you can infer more granular insights. You can pin down which particular service endpoints are experiencing errors, or perhaps information about which users are actively using them.
For the analogy, metrics can be represented as a magnifying glass with a blue lens on your data. In which case, your view of what’s happening in production would look a bit like this.
Tracing
We still have a problematic service in production. With high-cardinality metrics, we were able to pin down what is failing, and what users are affected — but the reasons why are still unclear. The next lens, tracing, can tell us some very important things we may need to know in order to find out. Traces help you look at individual system calls and understand the individual underlying steps taken to return a result.
Tracing tools (e.g. Jaeger) provide wonderful visibility into what’s happening with underlying components. Traces allow you to see things like which component took the longest or shortest period of time, or whether specific underlying functions resulted in errors. Traces can be a very useful way to more deeply investigate an alert triggered by your metrics system.
For example, you might be able to use the information found from your metrics dashboard to look for a trace that hits the same endpoint as the one experiencing problems. The trace might visually show us that the slowest part of a problematic request being issued, or an individual trace span, was a system call to a particular database. That span is taking significantly more time than usual.
But, already, we’ve hit a snag in continuity. The process of getting from a metrics tool to a tracing tool is bumpy. They’re two different types of tools collecting different types of data. In order to understand that the span is taking significantly longer than usual, you would need to somehow correlate information between both tools. That process can be time-consuming and error prone, often not providing the fast accuracy needed to debug production issues. The key data you need to correlate between the two might not even be available in both systems.
For example, your metric may indicate that page load times are spiking on a particular page for some users. But unless our metrics system and tracing system share the same underlying data, we may not be able to find traces that reflect that particular change in load times. We may have to search an entirely different system to find sample traces that will illustrate the problem we’re trying to hunt down.
In our analogy, tracing can be represented as a magnifying glass with a red lens. From this lens, the picture looks pretty different — but there are enough common attributes that we can successfully identify some parts in common and can often stay oriented between the images. Under this lens, some parts stand out more than others, while some aspects of detail entirely disappear.
Logging
Our work with tracing showed us where the underlying problem occurred: in one particular call to a certain database. But why did the database calls get slow? To continue to get to the root of the issue, you will need to examine what happened at the system or software level. The third lens, logs, provides the necessary insights into raw system information that can help us figure out what happened to your database.
For example, scrolling around in logs for that database, you might find some warnings issued by the database to show that it was overloaded at the time, or you may identify particularly slow queries, or you may discover that the event queue became too long. Logs help shed light on an issue once you know where to look.
But that micro-level view is extremely limited. For example, if you wanted to know how often this particular problem had occurred, you’d need to go back to the metrics tool to examine the history of that particular database queue (presuming you had metrics for that).
Like the other lenses, the process of switching between tools — in this case, from tracing to logging — requires a new set of searches, a new set of interactions, and of course more time.
For the analogy, we can think of logs as a green lens.
Putting the Lenses Together
Unfortunately, some observability solutions simply lump the views from these lenses together. They do that as separate capabilities and it’s up to the observer to determine the differences.
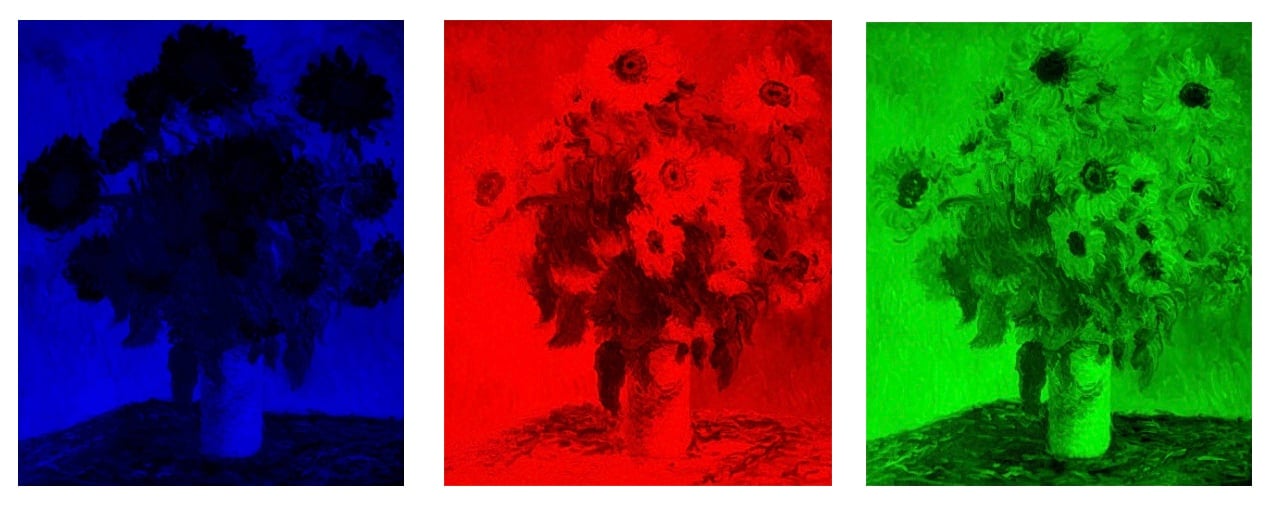
That’s not a bad start. As we can see, some attributes are completely invisible in one view, but easy to see in others. Side by side comparisons can help alleviate those gaps. For this example, each image brings different aspects more clearly into view: the blue image shows the outline of the flowers best; the red shows the detail in the florets; and the green seems to best highlight shading and depth.
But these three separate lenses have inherent limitations. Observability isn’t just the ability to see each piece at a time; it’s also the ability to understand the broader picture and to see how these pieces combine to show you the state of your system.
The Greater Sum of the Parts
The truth of your systems is that the aspects highlighted by each lens don’t exist separately in a vacuum. There is only one underlying system running with all of its rich attributes. If we separate out these dimensions — if we collect metrics monitoring separately from log and traces — then we can lose sight of the fact that this data reflects the state of one single underlying system.
A unified approach collects and preserves that richness and dimensionality. In order to see the full picture, we need to move through the data smoothly, precisely, efficiently and cohesively. When these lenses are unified into one tool, we can do things like quickly discover where a trace contains an anomaly that is repeatedly occurring in other traces, including finding out where and how often.
Observability tools don’t just need these essential lenses, they also need to maintain a single set of telemetry data and storage that retains enough rich context that we can view system events from the perspective of metrics, tracing and logs — all at once. Monitoring, tracing, and logs shouldn’t be different sets of data. Rather, they should be different views of the same cohesive picture. These lenses aren’t meant to view separate pictures. Each one simply brings certain aspects into a sharper focus. Observability tools should make it so that any point on a metrics line-chart (or a heatmap) connects to corresponding traces; any trace span should be able to query for views into log data.
The power of observability doesn’t just come from not having to switch contexts. Having a single data store also unlocks the ability to do things like visually slicing across your data. In other words, you can look at how two sets of events differ from each other, across all their various dimensions (i.e. fields). That’s the sort of analysis that isolated metrics systems simply can’t show (because they don’t store the individual events) or that would be prohibitively exhausting for a logging system.

Claude Monet, “Bouquet of Sunflowers,” 1881
Manually connecting these lenses means needing to make correlations on your own to find non-obvious problems. For our analogy, that would be like seeing an area that appears to be light-colored in both the green and red lens and intuiting that the common color must actually be yellow. Some artists may be able to infer that, a system could do the math for you, or you could flip back and forth between images staring at where bits contrast.
Observability lets you see the beautiful and complete picture that is your production software systems. You don’t need the skill and experience to combine those lenses in your mind to divine which shades of yellow might be a problem. All you need is parts that aren’t smaller than the sum of the whole.
Start Your Observability Journey Today with our eGuide, “Observability for Developers.”
Feature image via Pixabay.
At this time, The New Stack does not allow comments directly on this website. We invite all readers who wish to discuss a story to visit us on Twitter or Facebook. We also welcome your news tips and feedback via email: feedback@thenewstack.io.
